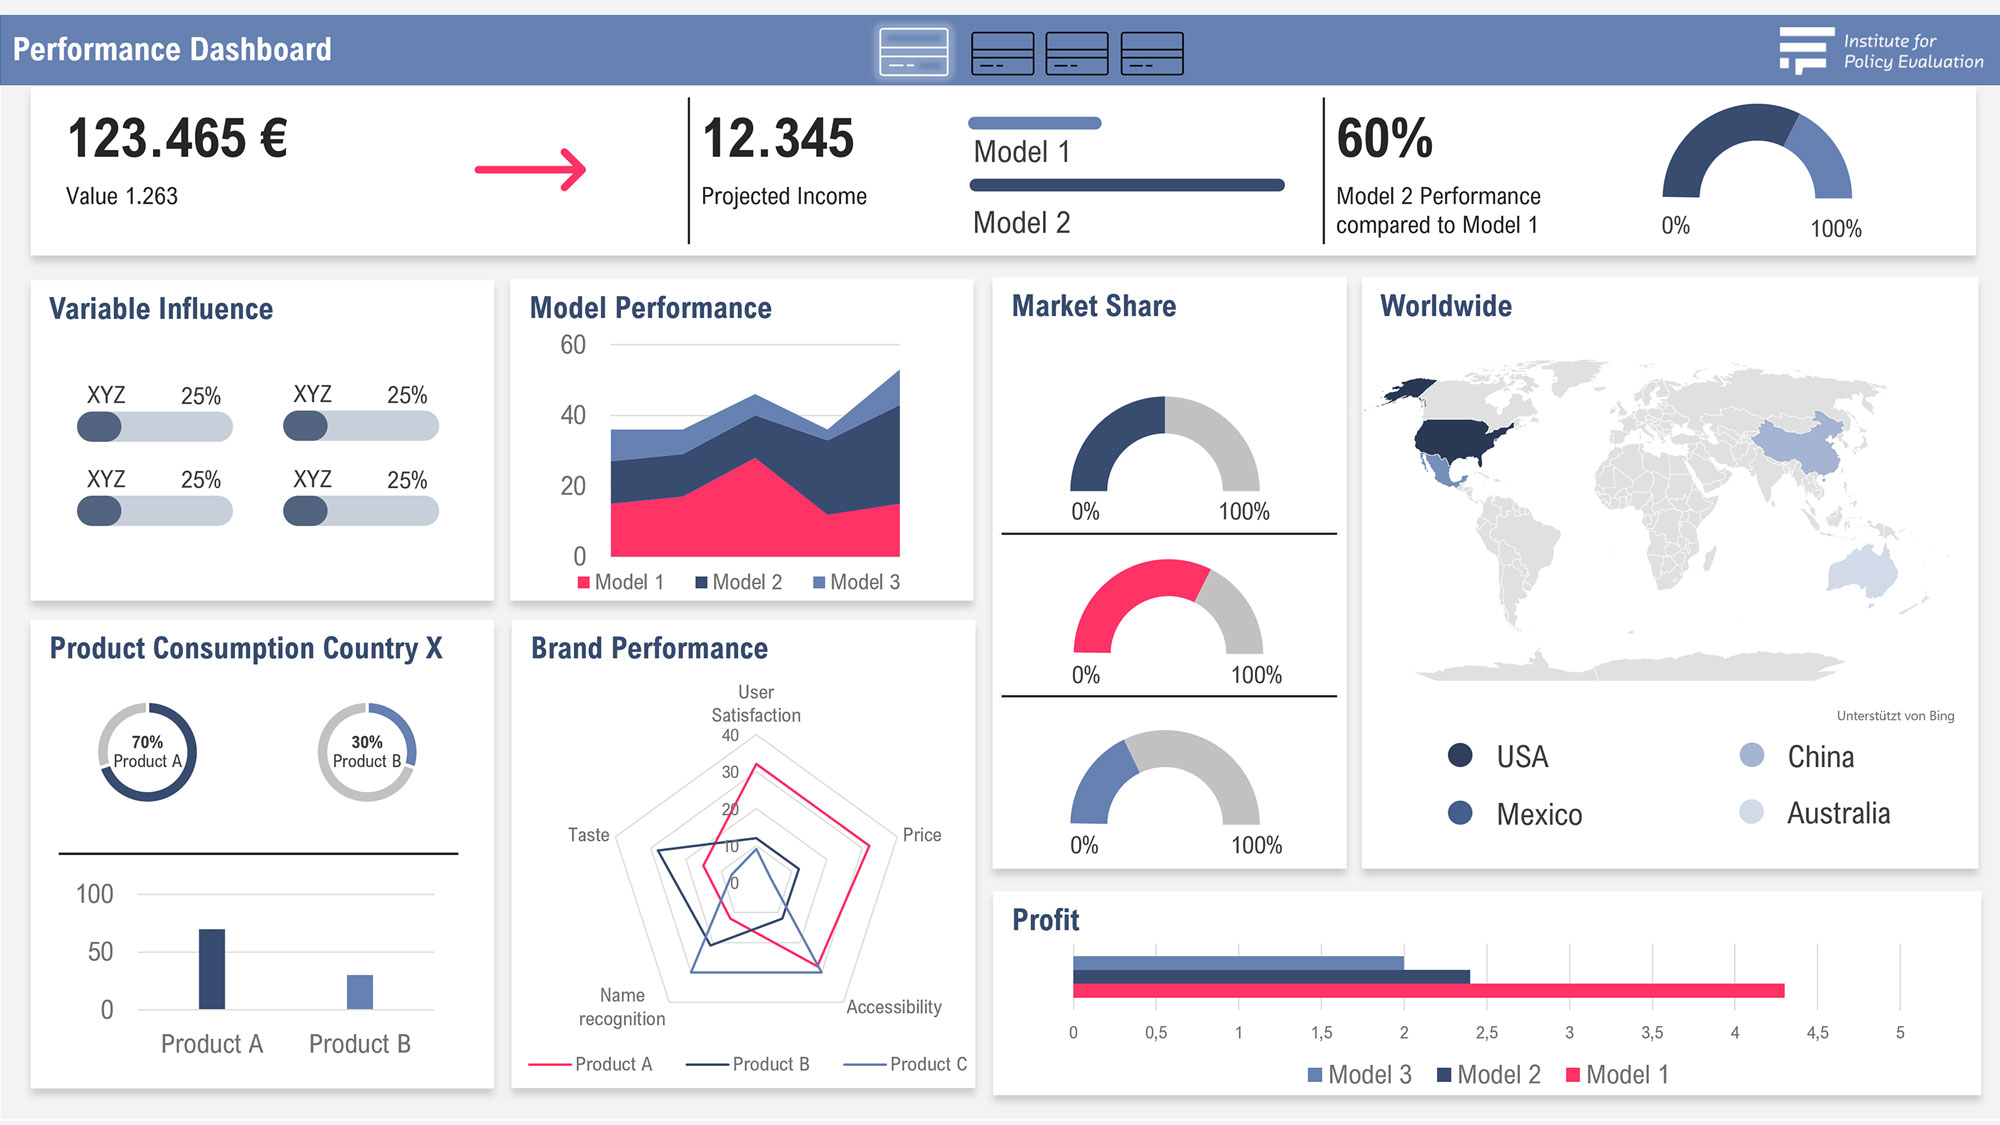
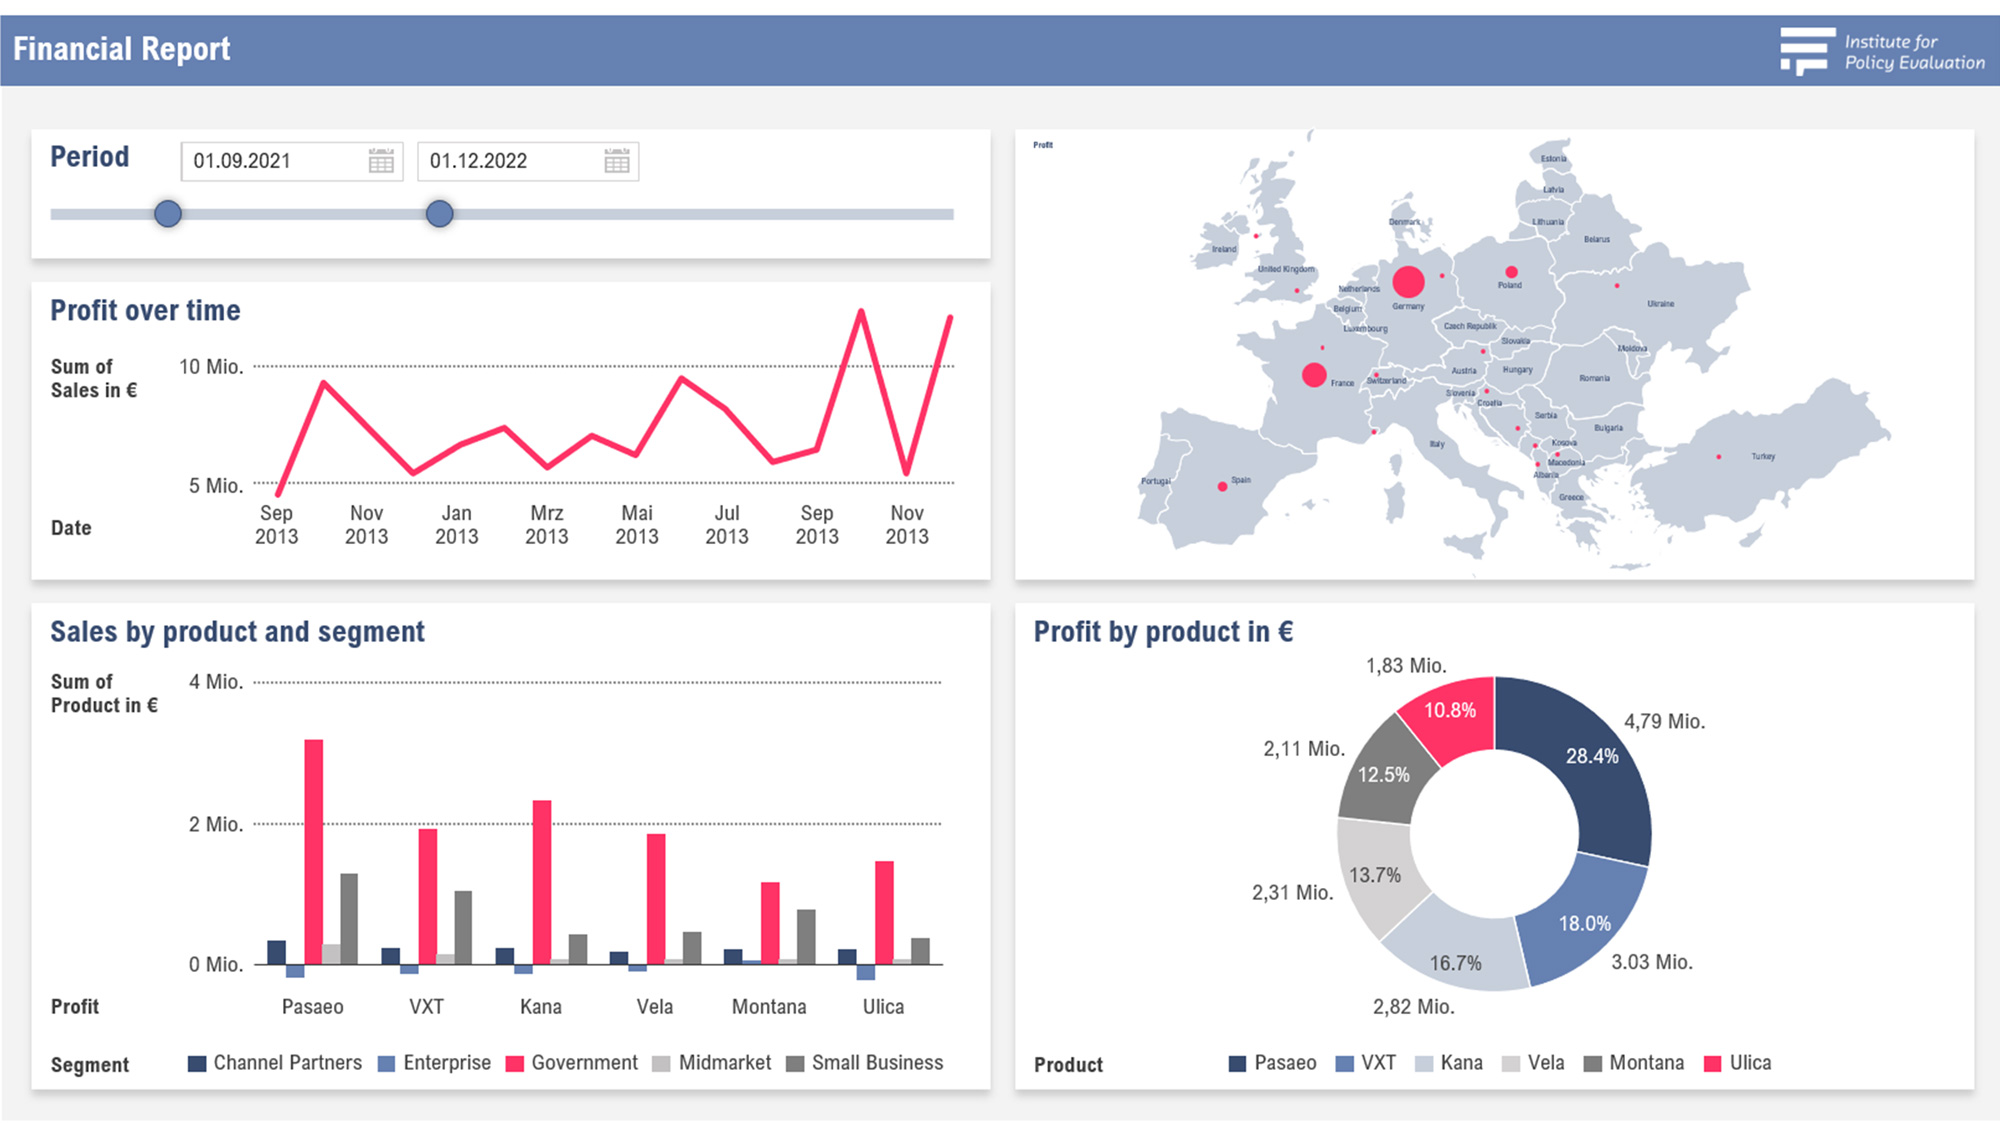
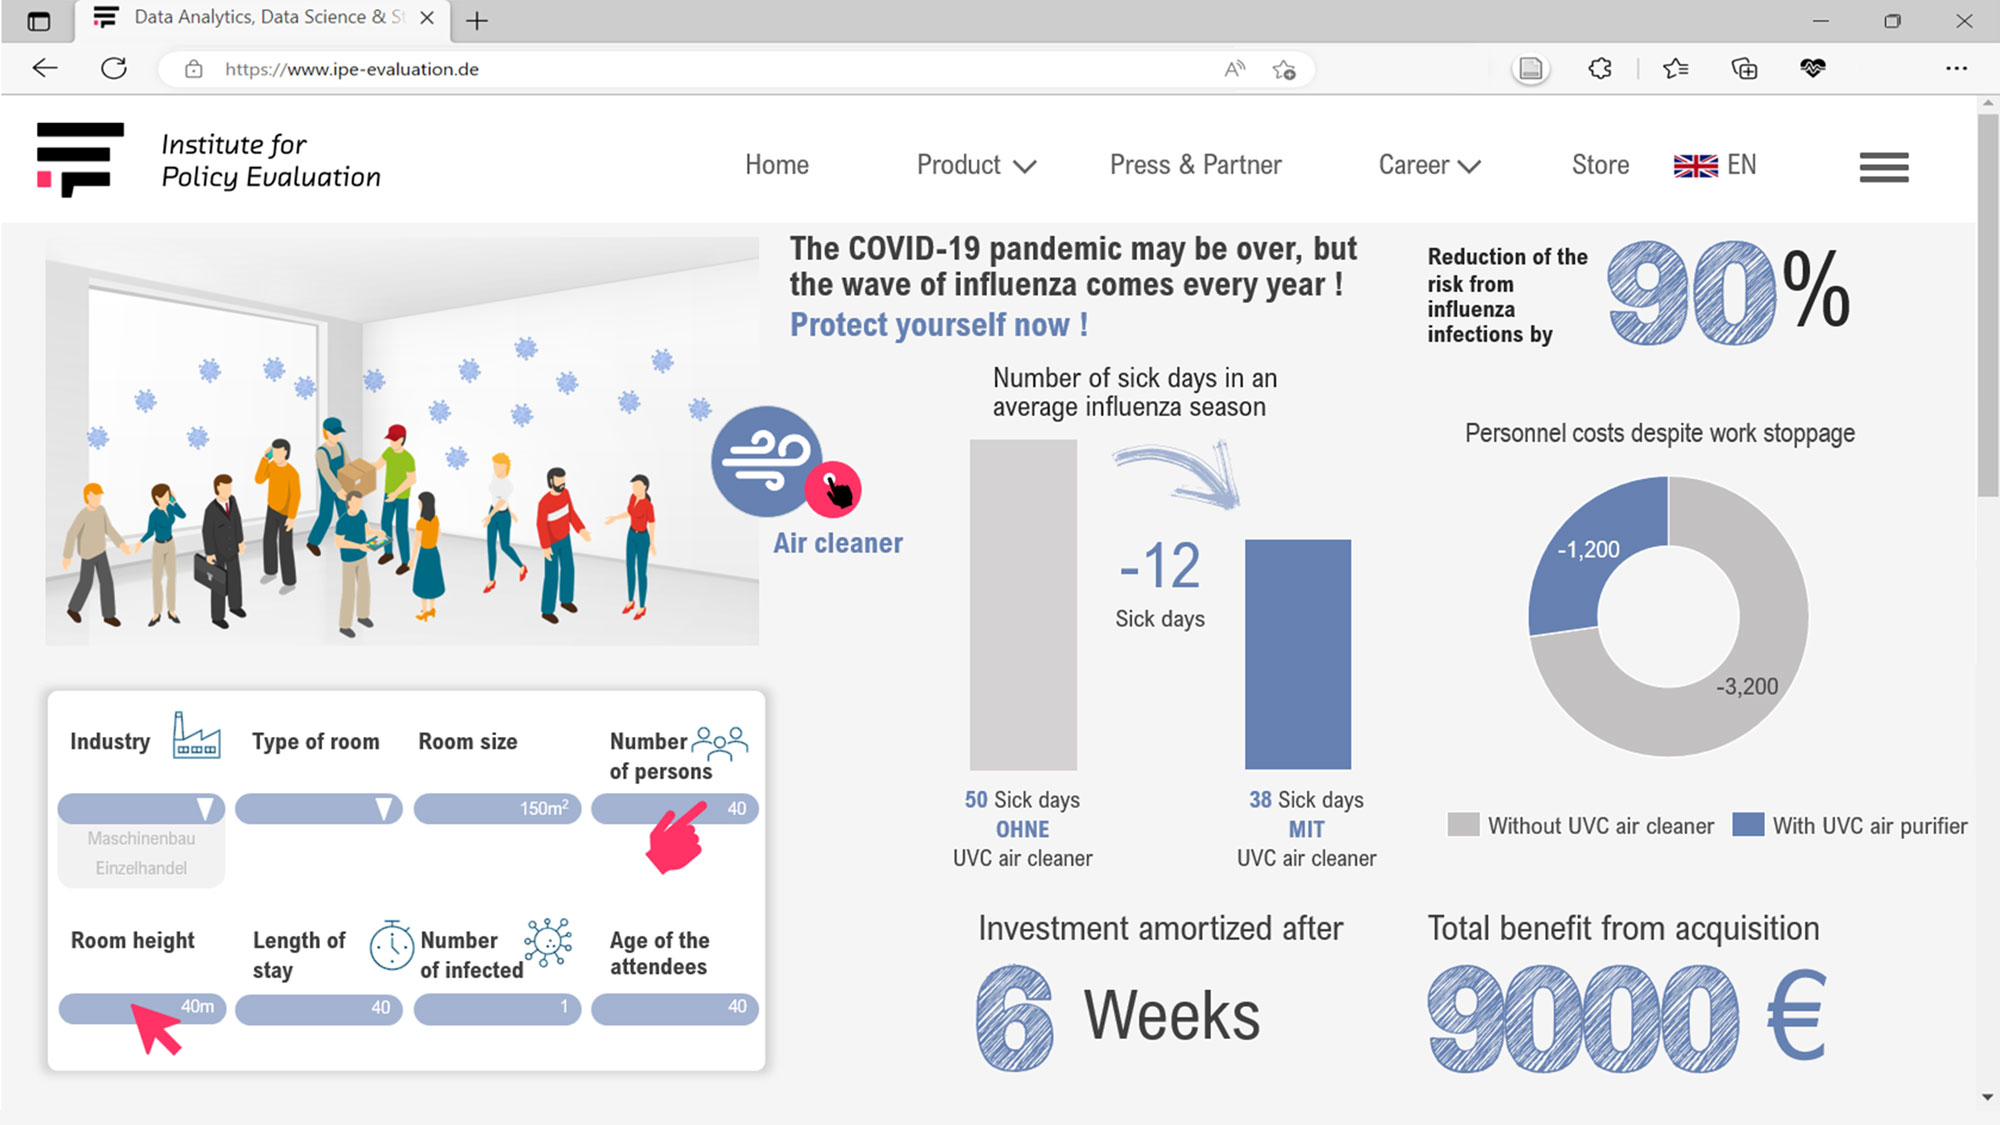
What are dashboards?
Dashboards provide a graphical overview of large amounts of data. Dashboards can be customised and adapted to virtually any need, as they are fed with data from different sources.
Advantages of dashboards
- Improved communication through reduced complexity
- Increased productivity thanks to automated data analysis
- Higher understanding of complex interrelationships
- Faster decision making
Possible expansion stages of our dashboards
01
Descriptive visualisation of inventory data
We prepare your data so that you receive a clear presentation of your results
02
Presentation of scenario-based model results
With the help of statistical modelling, we visualise different scenarios that support you in your business decisions.
03
Interactive simulation tool for personalised addressing
Responsive, dynamic filter settings or simulations allow interactive presentation of results
We tailor the dashboard exactly to your needs!
So you always see exactly what you want to see.
We stand by your side to improve the flow of information in and around your organisation.
Let's bring dynamism into dusty reports and reports together!